About
Jamie is a postdoctoral researcher studying astrophysics and cosmology at Princeton, with her PhD from Stanford and Ludwig Maximilians Universität München (LMU). Her primary research interests are large scale cosmic structure with weak gravitational lensing surveys, and photometric redshift calibration. As part of the LMU Astrophysics, Cosmology, and Artificial Intelligence research group (ACAI), she substantially contributed to the Dark Energy Survey Y3 Analysis and is an active member in the Dark Energy Spectroscopic Instrument (DESI), and the 4-metre Multi-Object Spectroscopic Telescope (4MOST) collaborations.
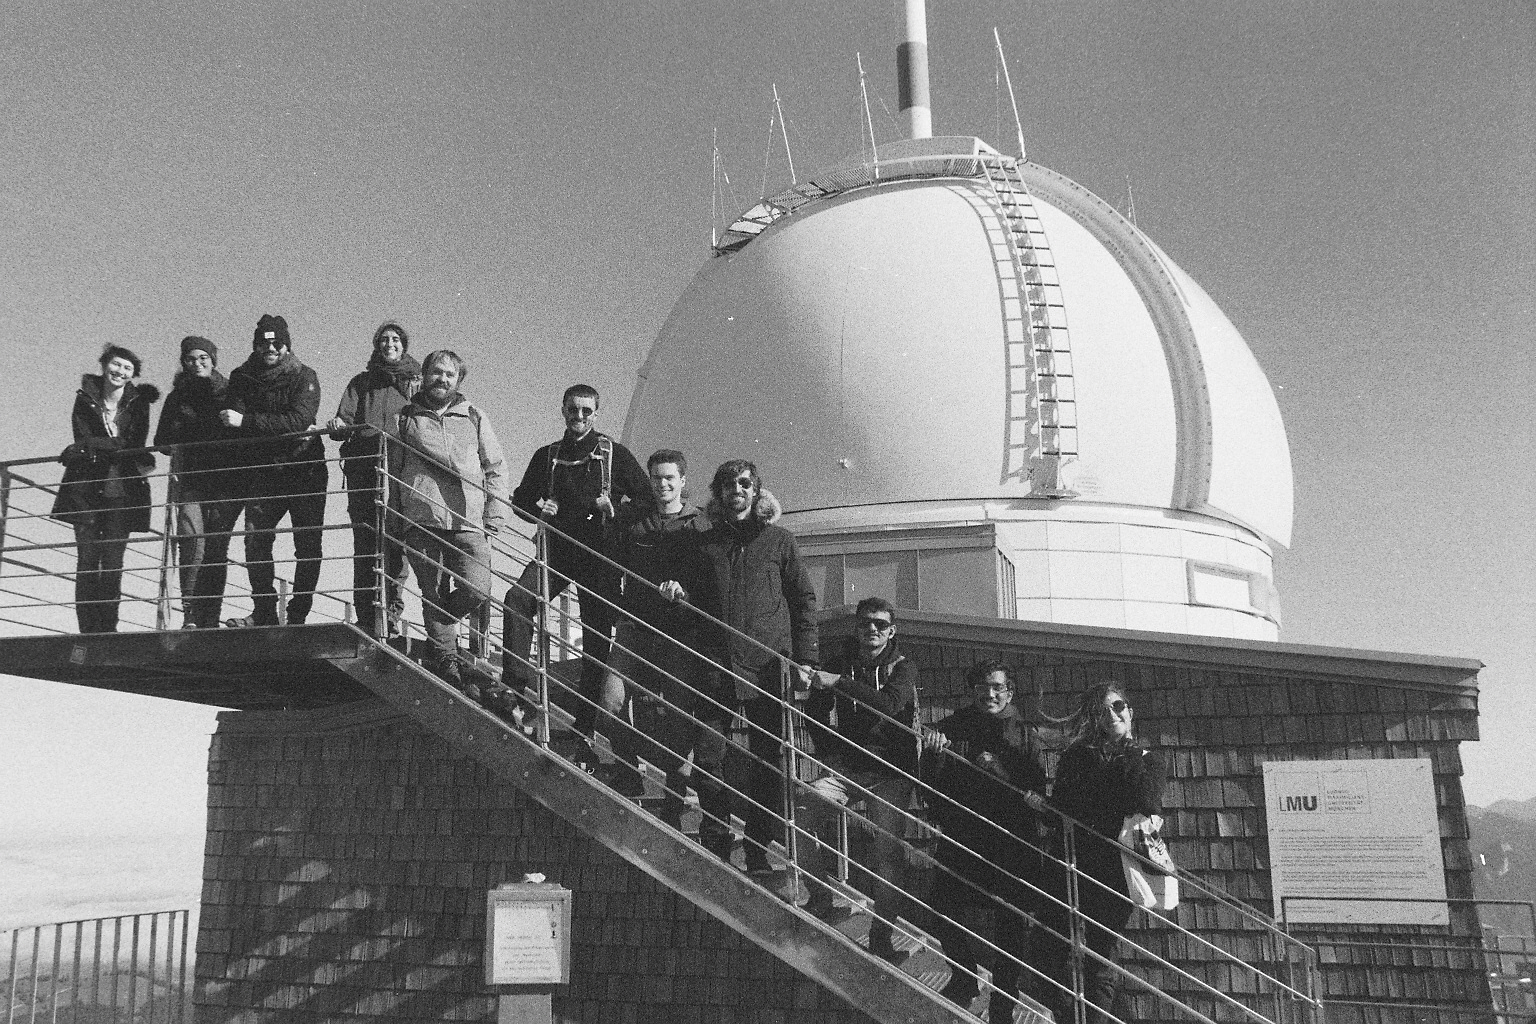
ACAI at the Wendelstein Observatory
Jamie McCullough
Research
Weak Lensing and the Calibration of the Color Redshift Relationship
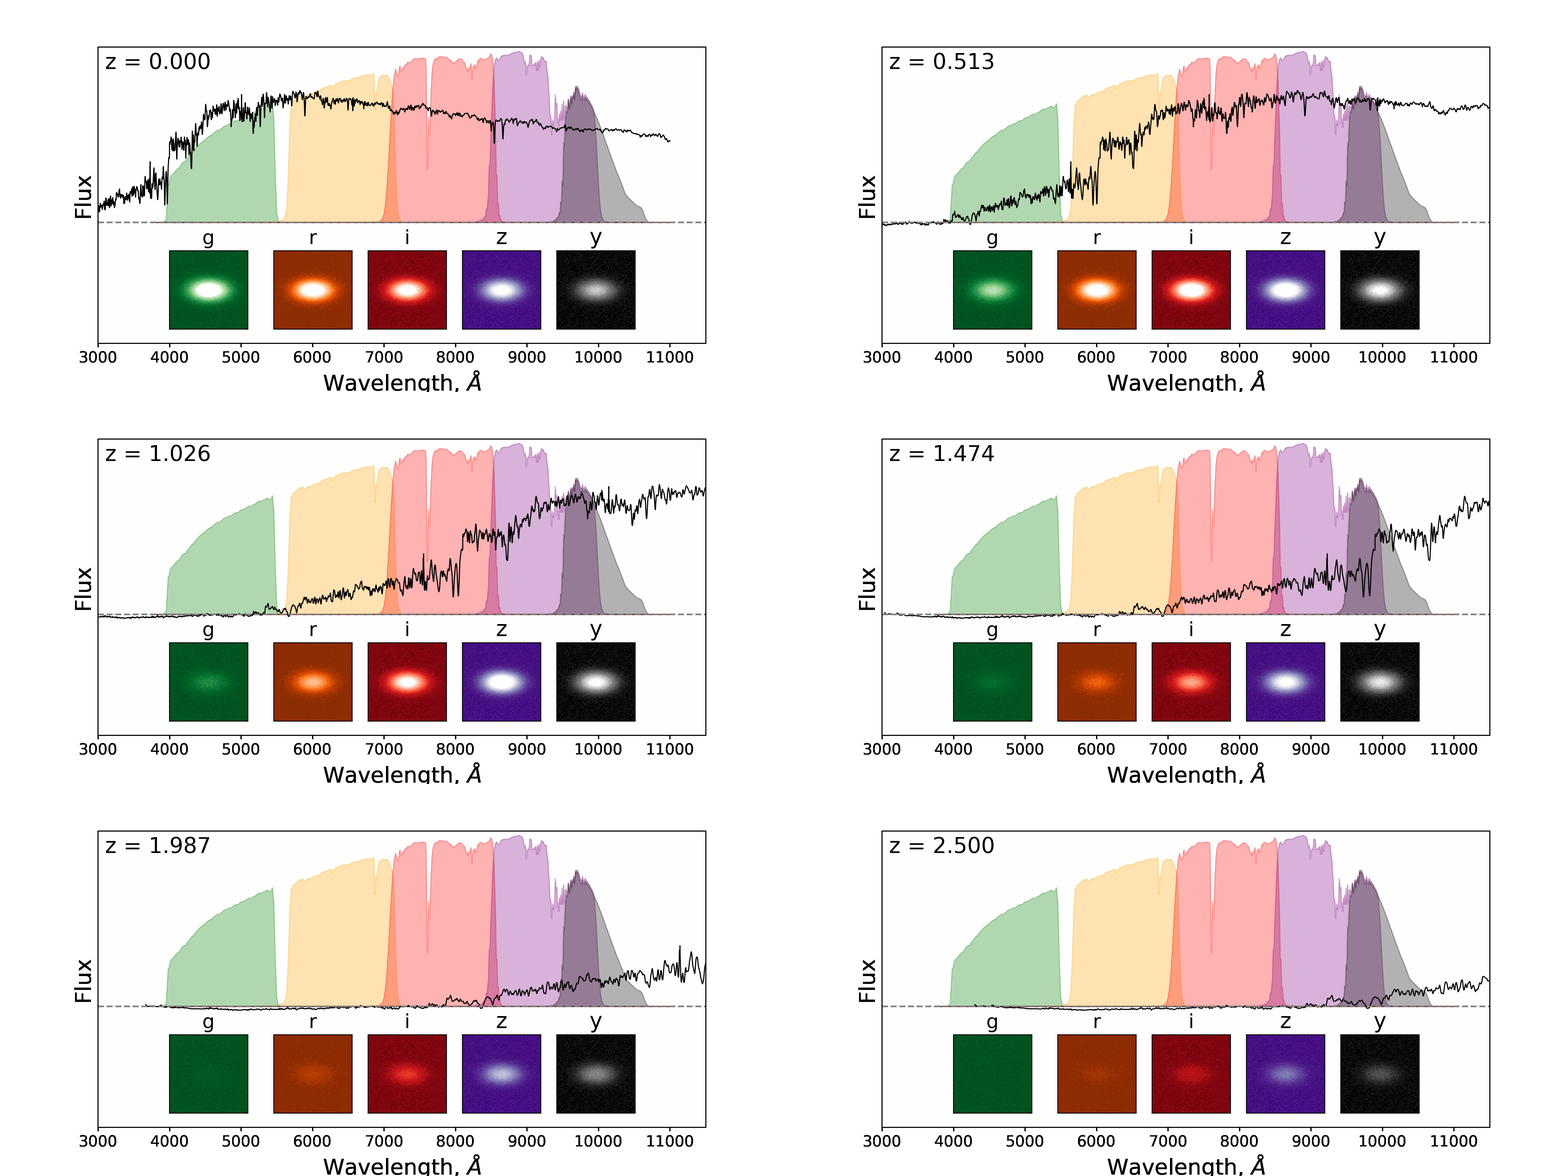
Galaxies put out a lot of light, and that light tells us a great deal about the astrophysics inside that galaxy. Since the universe is rapidly expanding, we can also use the doppler shift in the light of a galaxy to measure its redshift, a proxy for distance. For mapping the matter distribution of our universe and the growth of structure over time, getting redshifts for galaxies with only a few pieces of color information is critical. Below you can see an example of the Dark Energy Survey grizy filters (shaded) and how they might image a red elliptical galaxy that has stopped forming new stars. As the galaxy grows higher in redshift, z, you can see the light shifts to redder wavelengths and the sharp drop off in flux on the blue end of the spectrum (black line) can be seen passing through our five images from left to right. Since we know this drop off (the balmer break) happens at around 400 nm at rest, we can use our pictures to estimate the redshift and thus the distances to galaxies that look like this one. This is just one example of the color-redshift relation for a specific kind of galaxy. The full picture is much more complex!
If we can combine distance information with galaxy shapes, we can tease out distortions in light from large scale structure. Because the amount of lensing, or distortion of galaxy shape, relies so heavily on distance and the geometry of the lens-background pair, good shape measurement and good distance estimators are crucial.
DESI
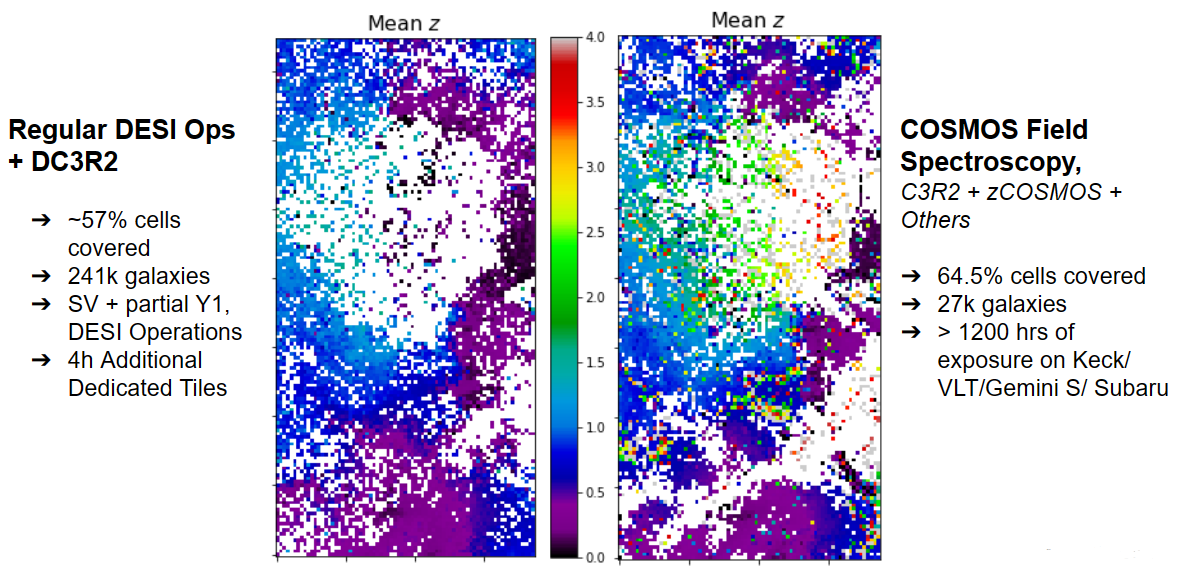
One core effort from my work is the DESI Complete Calibration of the Color Redshift Relationship (DC3R2, see the astrobites summary). DC3R2 began as a spare fiber proposal that made use of existing 9-band (ugriZYJHKs) photometry in the KiDS-VIKING northern field to select by color. The result is a collection of galaxies that have sufficient photometric information to break most color-redshift degeneracies as well incredibly accurate DESI spectroscopic redshifts. In the figure below, on the left hand side you can see how DESI alone compares to the much smaller, but very well studied COSMOS field on the right.
Access the publicly available DC3R2 data set, data visualizations and learn more on the DC3R2 Overview page.
4MOST
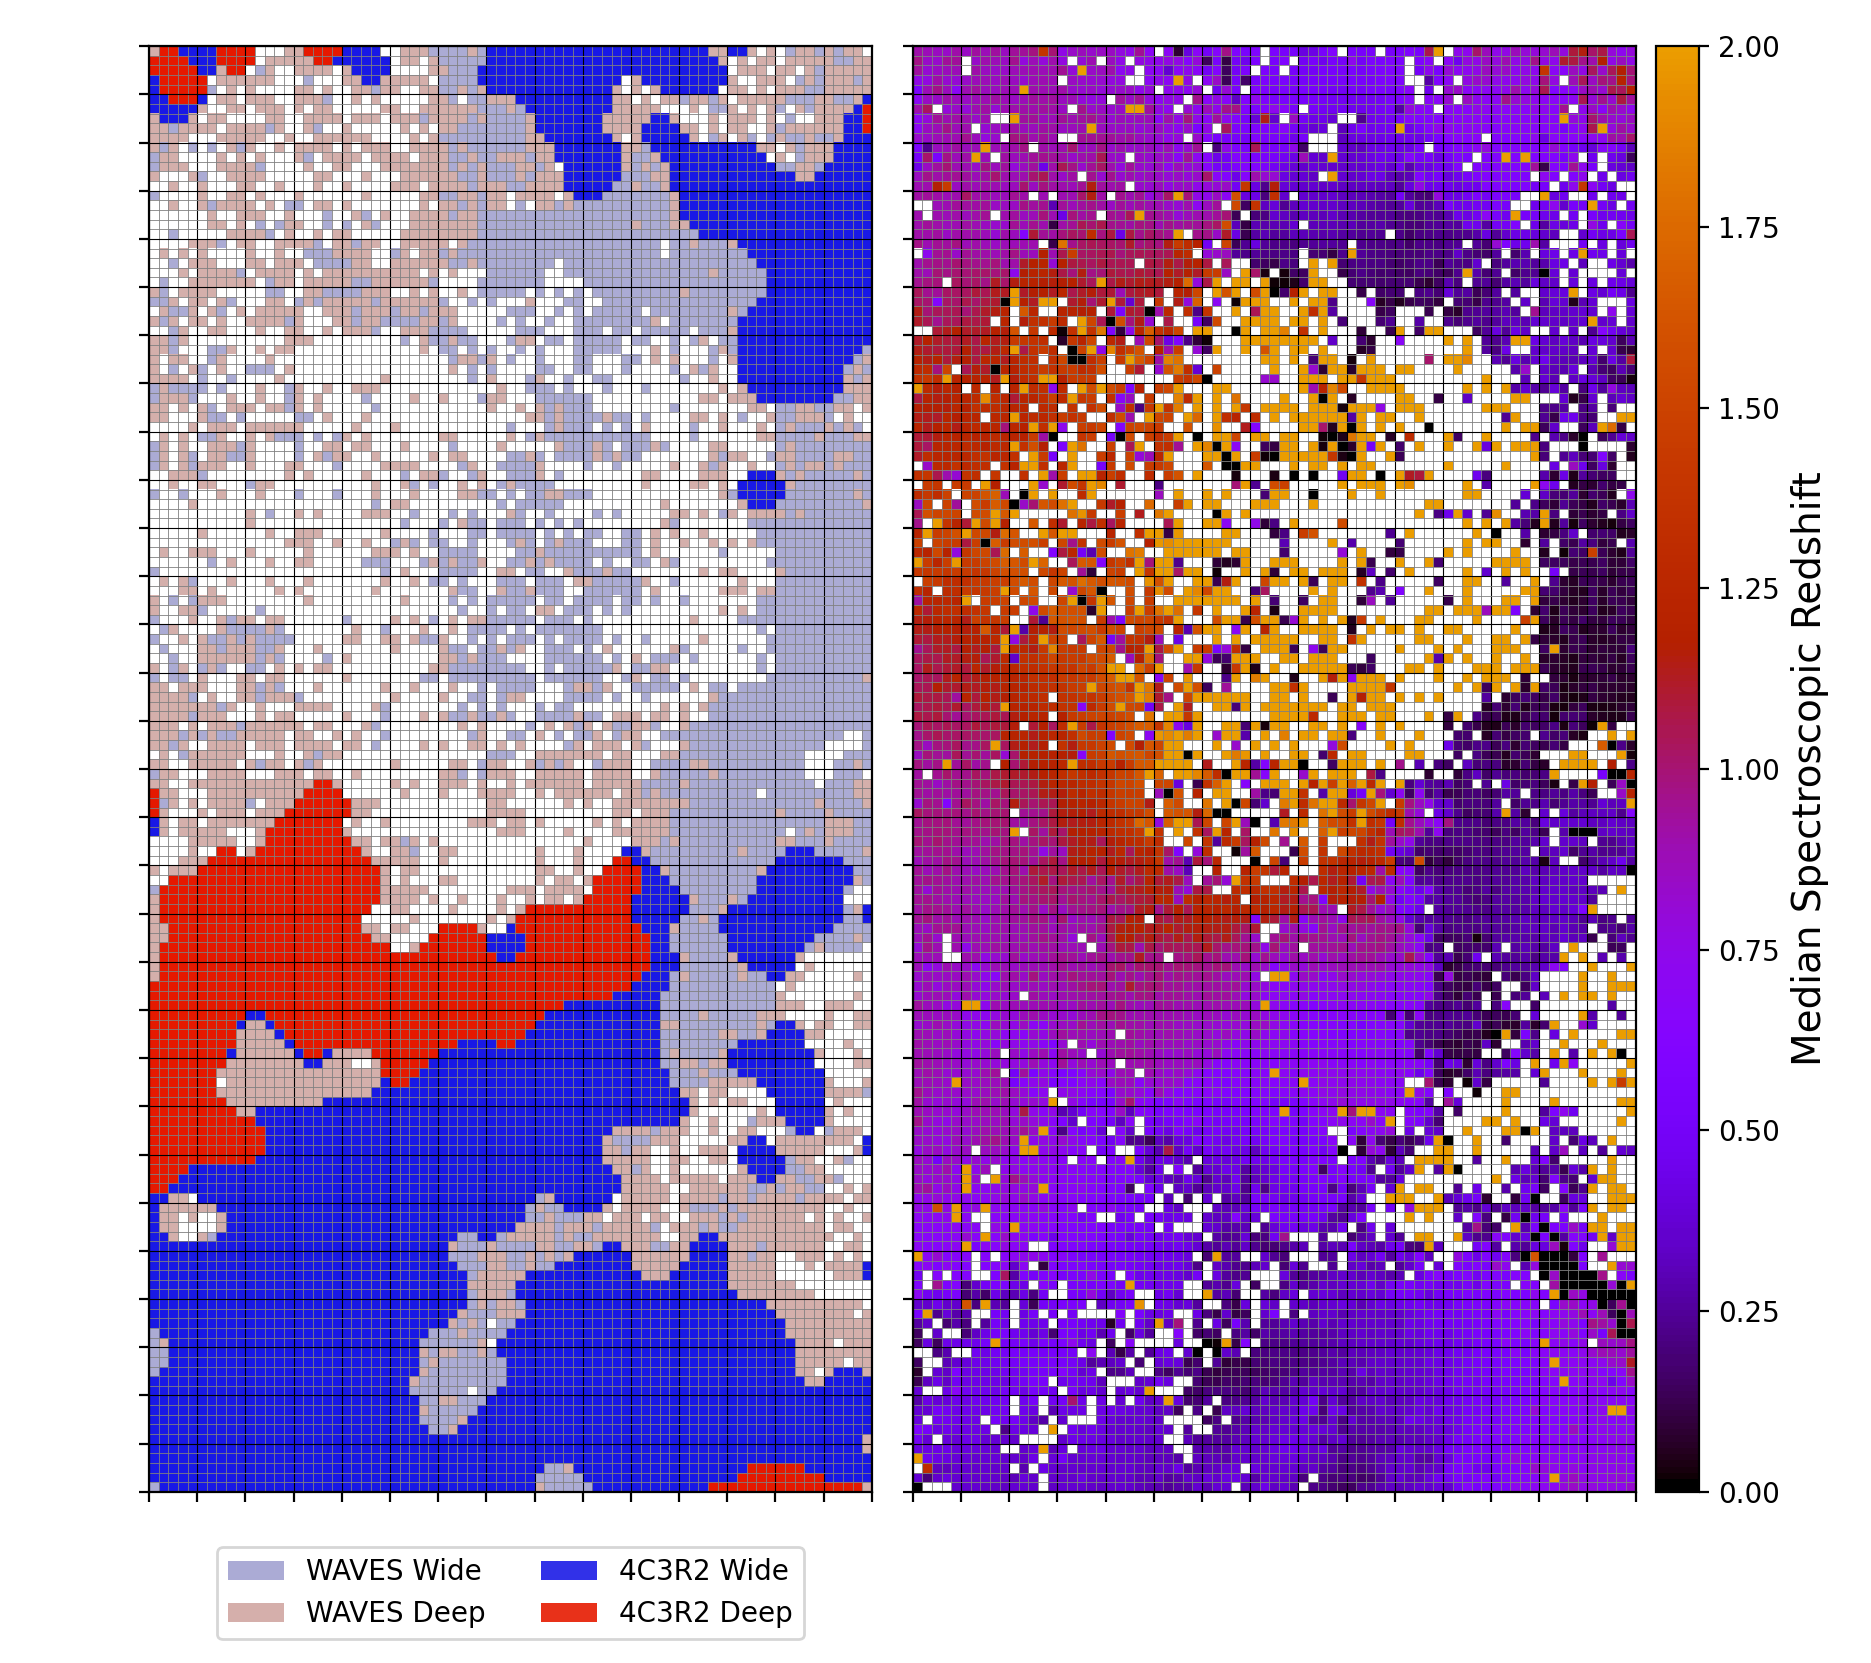
As one of the PIs for the 4MOST Complete Calibration of the Color Redshift Relationship (4C3R2) extragalactic survey, I aim to fill the spectroscopic color-space that galaxies visible to the future, ultra-deep lensing surveys will span. 4C3R2 aims to uniformly cover with high multiplicity the color space complementary to WAVES, as seen in the figure below.
(Left) The proposed 4C3R2 wide (red) and deep (blue) color selection in the Masters+ 2017 self-organizing map, which covers Euclid/Rubin like depth. Faded cells depict the estimated, complementary WAVES selection.
(Right) The existing spectroscopy in the field, from preliminary DESI results and previous, sparser high-redshift searches in the COSMOS field.
Shear Calibration and Shape Measurement
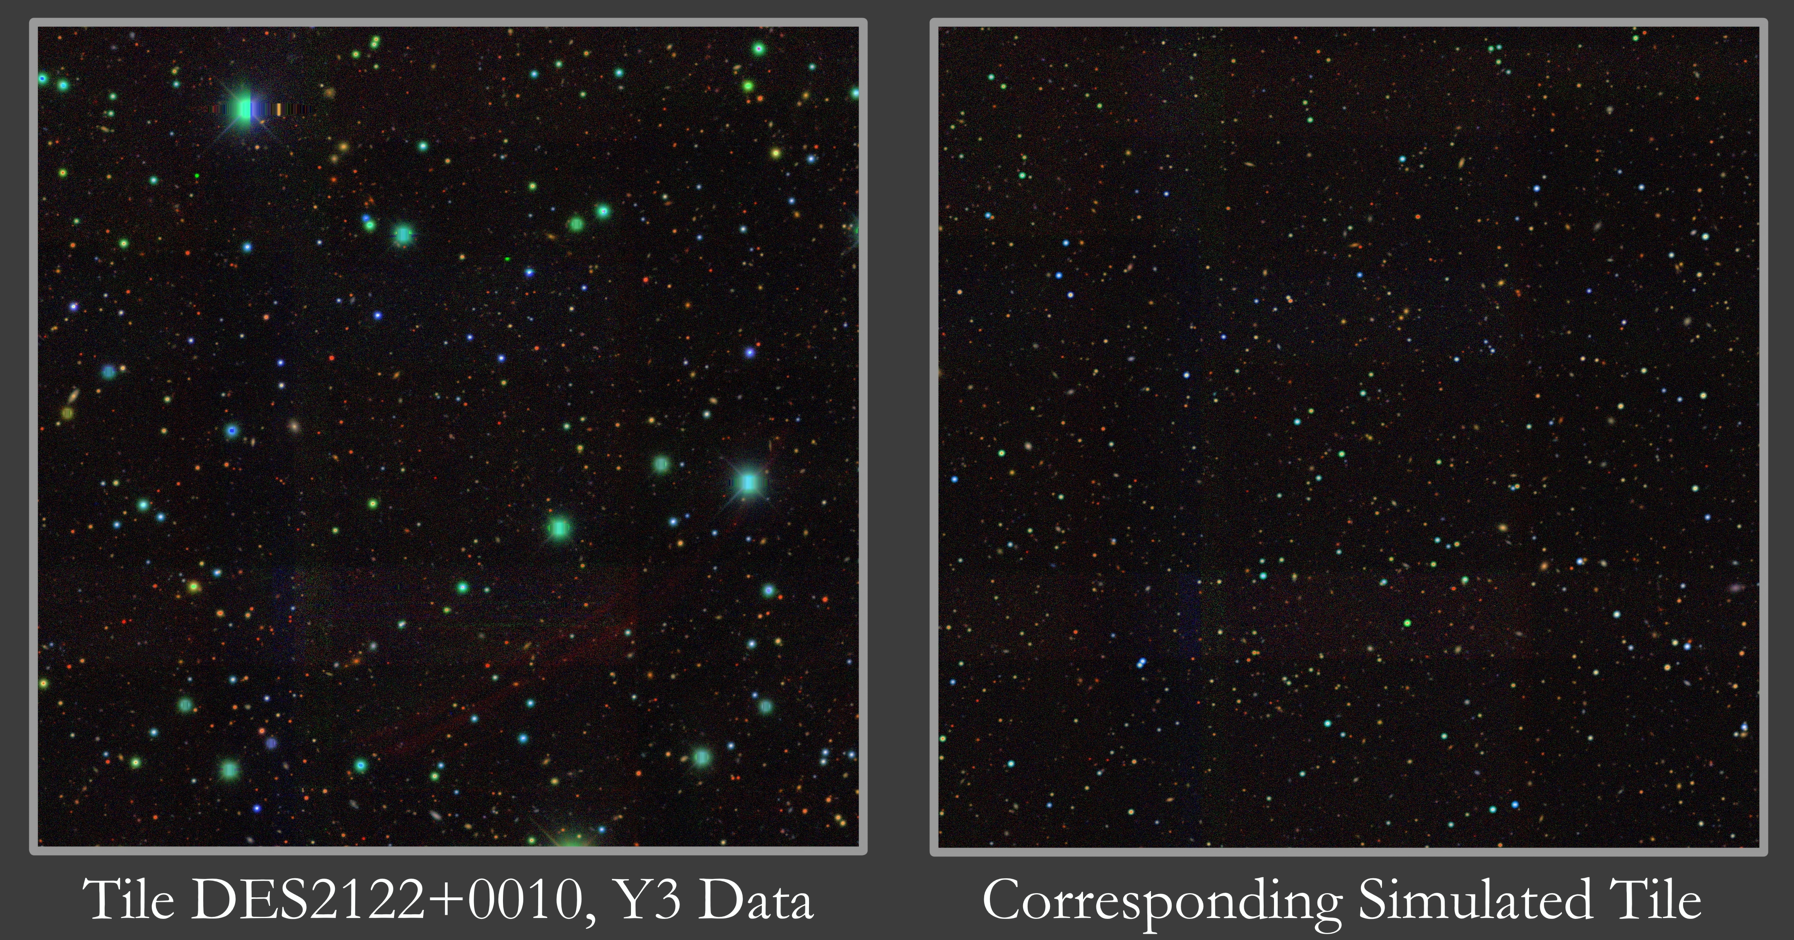
The Dark Energy Survey Year 3 (DESY3) produced a novel shear calibration effort that examined how shear bias (our ability to understand how galaxies are sheared based upon their shapes) depends on galaxy-galaxy blending and redshift, or distance. See (MacCrann et al 2022) arxiv for more information on how image simulations are used to more deeply understand photometric surveys and this article for a high level summary.
Major Publications (ORCiD / ADS)
- DES Y3 Results: Blending shear and redshift biases in image simulations, (MacCrann et al., 2022) arxiv, MNRAS
- DES Y3 Results: Weak Lensing Shape Catalog, (Gatti et al., 2021) arxiv, MNRAS
- DES Y3 Results: Redshift Calibration of the Weak Lensing Source Galaxies, (Myles & Alarcon et al., 2021) arxiv, MNRAS
- DESI Complete Calibration of the Color Redshift Relation (McCullough et al., 2024) arxiv,MNRAS
- 4MOST Complete Calibration of the Color Redshift Relation: An Overview (Gruen & McCullough et al., 2023) ESO Messenger
- DES Y3: Cosmic shear and intrinsic alignment in color, (McCullough et al, in prep)
Leadership and Teaching Assistantship Experience
- Co-Team Lead: DESI Topical Group on Photometric Redshifts
- Co-Principal Investigator: 4MOST Complete Calibration of the Color Redshift Relation (4C3R2)
- Essentials of Advanced Astrophysics (LMU Munich, graduate)
- Physics 16: Origin and Development of the Cosmos (Stanford, undergraduate)
- Physics 100: Introduction to Observational Astronomy (Stanford, upper division undergraduate)\
Teaching Resources
Access a collection of didactic figures freely available on the visualizations page.
Do you have a cheap, plastic spectrometer (e.g. this one)? Explore the properties of light and spectroscopy and make a measurement for how long the sun can burn!
Some Talks and Articles
- American Physical Society April Meeting, 2022, (The Role of DESI in Photo-z Inference for LSST, Euclid, and Future Cosmological Surveys) (Slides)
- A KIPAC Blogpost: (How to tease out the tiniest distortions of galaxy shapes to probe the secrets of the Universe)
- Poster: (Detection Sensitivity for the Gemini Planet Imager (GPI) to Potential Europa Plumes)
- Spectral Analysis of Spacecraft Via HETDEX
- A Brief Introduction to Heavy Element Synthesis and Neutron Star Mergers
- An Aside on the Bussard Ramjet
$ curl https://jmccull.github.io/
<title>Redirecting...Redirecting...

